246. Value 💶
Intro to Van Westendorp, Max-Diff, and conjoint surveys for measuring your pricing strategy
Thank you for being part of this newsletter. Each week, I share playbooks, case studies, stories, and links from inside the startup marketing world. You can click the heart button 💙 above or below to share some love. And you can reach out to me anytime at hello@kevanlee.com. I’d love to hear from you.
Links that are worth your time:
This new Twitter commercial is … different :)

Hi there 👋
We’re growing the team at Oyster (check out our open roles here), and one of the many new joiners I’m excited to welcome is a pricing strategy analyst. In preparing for this person to come on board, I’ve been deep in the world of pricing these past few weeks, which spurred the idea for the essay below. Monetization is one of the biggest growth levers at your disposal (THE biggest according to some folks), but even so, this will be the first full-time in-house pricing person I’ve had the pleasure of working with. How about you? How does pricing & monetization work at your company? Hit reply to let me know; it’d be great to hear from you.
Wishing you a great week,
Kevan
P.S. The two resources I’ve bookmarked for our new pricing analyst are this ebook from Profitwell and this substack from Rob Litterst.
Value-based pricing: The three pricing surveys that you should always be running
When we talk about monetization at Oyster, we break pricing strategy down into three buckets:
Cost-based pricing — A pricing strategy that is pinned to your desired margins and cost of goods sold
Competitor-based pricing — A pricing strategy that is in line with what your competitors are charging
Value-based pricing — A pricing strategy that bases your price on your users’ willingness to pay for your services
It’s this last pricing strategy (value-based) that’s the hardest to come by because it requires a fair amount of customer research, market research, experimentation, and courage. But the payoff can be tremendous.
Value-based pricing is often how companies end up with a value metric that allows price to scale quite elegantly as users find more and more value with your company. The team at Reforge says it like this:
As a reminder, price can scale in a few different ways. The first is through feature differentiation. This is where users buy into a set of features and price scales as they want to add more features. The second is price scaling with usage. There are usage based value metrics, like Figma charging per editor or Slack per active user. And the final way that price can scale is with outcomes. These are outcome based value metrics, like per lead through Thumbtack, per ticket sale for Eventbrite, or per seat for OpenTable.
Which scale is right for your business? Or, magically, can you get more than one scale to work?
Well, a lot depends on what your users have to say about their willingness to pay for what you offer.
Take, for instance, a social media management tool like Buffer. We can build all the same features as competitors like Sprout Social or Hootsuite, and we can price it all the same, but do users really value all of the features equally? If we built Twitter threads into the product, would people pay a premium? If we built a Dropbox integration, would people be willing to pay more, or would they just shrug?
The answer, as you may have guessed by now, is that you have to ask your users what they think.
We’ll be doing a bunch of this at Oyster, and I’ll be happy to share any of the outcomes with you. Similarly, if you’ve run any willingness-to-pay surveys, I’d love any insights you’ve gleaned.
Here are the three main pricing surveys that we’ll have always-on.
1 - Van Westendorp
Introduced in 1976 by Dutch economist Peter van Westendorp, this survey shows you the price sensitivity of your users. It’s a simple four-question survey that you then map in a particular way to discover the delta of what’s too cheap and what’s too expensive.
You tell the survey respondent about your product, and then you ask them, “At what price would you consider the product to be …
“Priced so low that you would feel the quality couldn’t be very good” (This tells you the ‘too cheap’ price)
“A bargain — a great buy for the money” (This tells you the ‘cheap’ price)
“Starting to get expensive. It’s not out of the question, but you have to give some thought to buying it” (This tells you the ‘expensive’ price)
“So expensive that you would not consider buying it” (This tells you the ‘too expensive’ price)
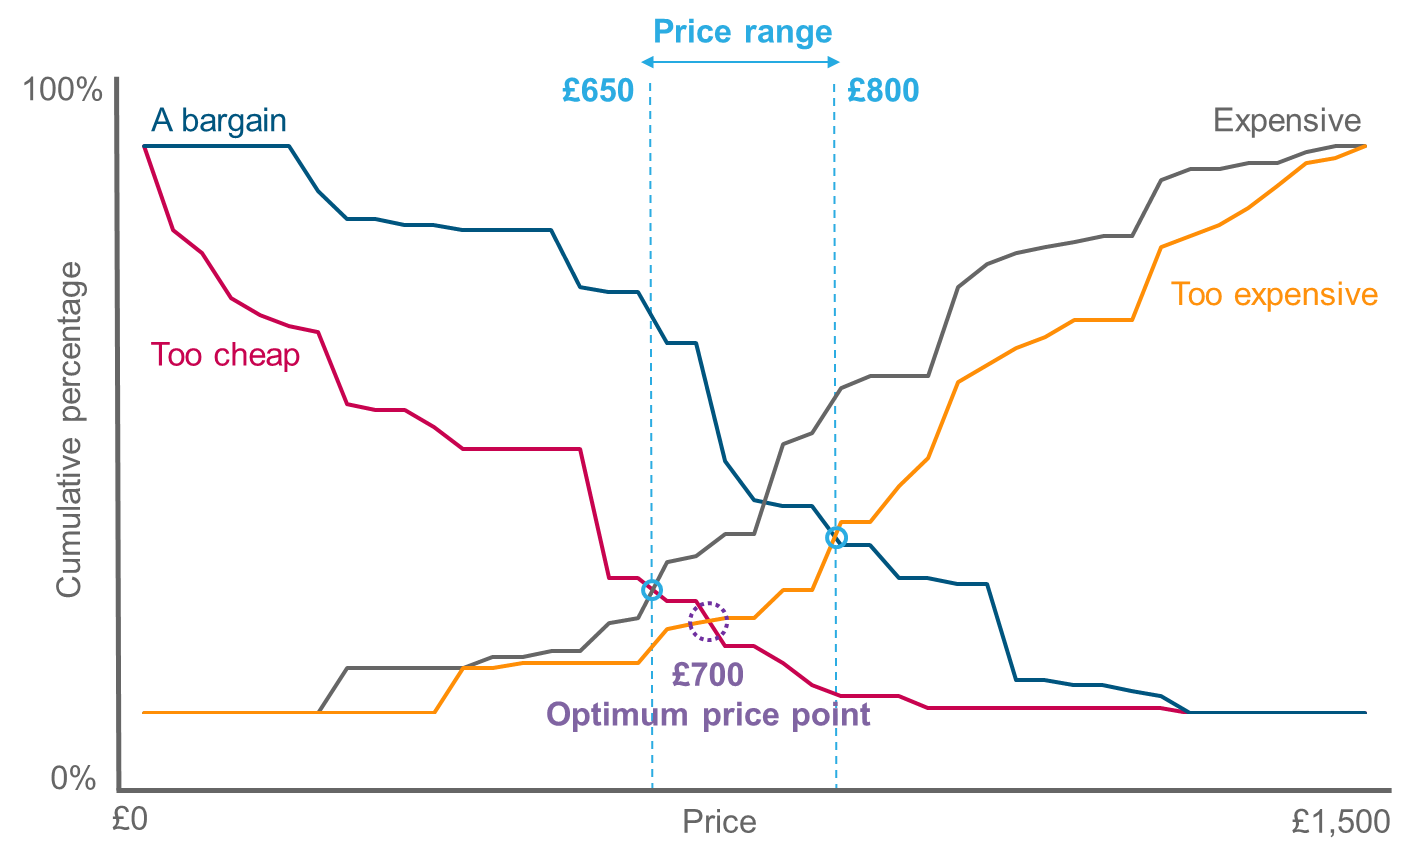
The output of this survey is a chart with four intersecting lines, and each intersection tells you a datapoint for your pricing strategy. Here’s a sample van Westendorp chart:
Conjointly has a great recap of this whole survey process, and you can run the survey through them as well. The outputs from this chart are four different price points, including (amazingly) the optimal price point:
The intersection of `too cheap` and `too expensive` is considered the optimal price point
The intersection of `too cheap` and `expensive` is considered the low end of the price range
The intersection of `cheap` and `too expensive` is considered the upper end of the price range
The intersection of `cheap` and `expensive` is the normal price point (the point at which an equal number of people thought it was either cheap or expensive)
2 - Max-Diff
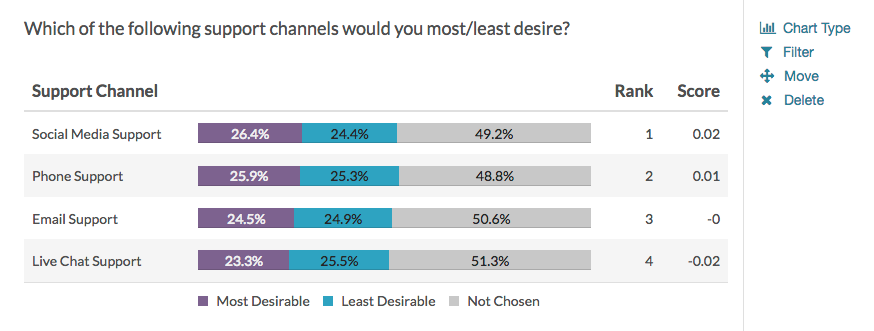
In a Max-Diff survey, the questions are even more straightforward. You list a number of attributes of your product and ask your survey respondents to tell you what they value most and least.
Example:
After gaining a bunch of data, you analyze it using a formula and chart. To create a metric value for each attribute, you take the number of times the attribute appeared as best (minus) the number of times the attributed appeared as worst and (divide) by the number of times you ran the survey.
This should give you a score, which lets you chart the Max-Diff results like this:
The Max-Diff survey doesn’t give you insight into price sensitivity, but it does help you identify which of your features are most valuable and therefore the best potential to monetize.
3 - Conjoint
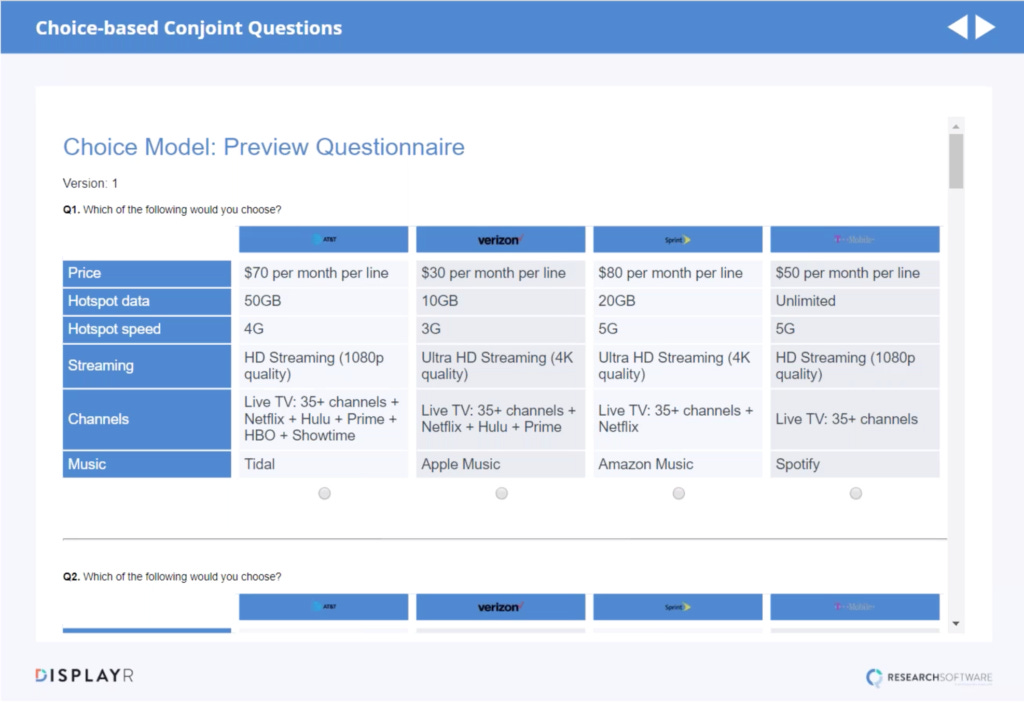
In a conjoint analysis, you give the survey respondent actual pricing packages to pick between, which is fantastic because you get some real feedback on potentially real packaging (less fantastic in that you have to do quite a bit of legwork to get these surveys built).
Example:
Typically a conjoint analysis would follow a Max-Diff and Van Westendorp, both of which will help you create the price and package and value metric that you’ll test.
Over to you
What pricing surveys have you found most helpful? Have you ever run a Van Westendorp or Max-Diff before? I’d love to hear your thoughts.
About this newsletter …
Each week, I share playbooks, case studies, stories, and links from inside the startup marketing world. If you enjoy what’s in this newsletter, you can share some love by hitting the heart button at the top or bottom.💙
About Kevan
I’m a marketing exec who specializes in startup marketing and brand-building. I currently lead the marketing team at Oyster (we’re hiring!). I previously built brands at Buffer, Polly, and Vox.
Not subscribed yet? No worries.
I send a free email every week or so. You can check out the archive, or sign up below:
Already subscribed? You’re in good company …
I’m lucky to count thousands of subscribers as part of this list, including folks from awesome tech companies like these:
Thank you for being here! 🙇♂️


